
The gold price is trading below $1,850, its lowest level since March 10. Thus, starting the last quarter of this year on a negative note. With the support of the new rise, the dollar is consolidating the previous recovery above the 106.00 level against its main rivals.
Gold price continues its decline as pressure increases
The gold price extended its losing streak to a sixth day on Monday as the US Dollar struggled to find new demand amid caution despite the US averting a government shutdown. The U.S. Congress late Saturday averted the fourth partial shutdown of the federal government in the past decade. To that end, lawmakers voted to pass a temporary funding bill with overwhelming support from Democrats.
Meanwhile, China’s business PMIs were mixed over the weekend. This dampened investor sentiment in the light trading environment caused by the Chinese gold week holiday. Caixin/S&P Global manufacturing purchasing managers’ index (PMI) decreased to 50.6 in September from 51.0 in the previous month. Thus, it missed the predictions of 51.2. The services index also decreased from 51.8 in August to 50.2 in September. This data also reached its lowest value since December. These data are of partial importance for the gold price. According to official data released by China’s National Bureau of Statistics (NBS) on Saturday, Manufacturing PMI and Non-Manufacturing PMI exceeded expectations at 50.2 and 51.7, respectively, in September.
Gold focused on critical US data and Powell speech
Moreover, the persistent hawkish rhetoric of the US Federal Reserve (Fed) and the resilient US economy continued to maintain the buoyant atmosphere on the US Dollar and US Treasury bond yields. U also left the gold price, which has no return, at seven-month lows. Attention now turns to critical employment data from the US, starting with JOLTs Labor Gaps, which will be released on Tuesday and will offer new information about the country’s labor market as inflation declines. The Fed most prefers Core Personal Consumption Expenditures (PCE) as its measure of inflation. This Price Index softened in August to 0.1% monthly and 3.9% annually.
Meanwhile, the US ISM Manufacturing PMI and Fed Chairman Jerome Powell’s speech later in the day have the potential to significantly impact US Dollar valuations and gold price movement. Because these data will provide new clues about the economy and interest rates outlook.
Gold price technical analysis: Downward momentum continues
Market analyst Dhwani Mehta evaluates the technical outlook for gold as follows. Gold confirmed a symmetrical triangle breakout and a ‘Death-Cross’ last week. Subsequently, the downward momentum in the gold price remains intact. However, the 14-day Relative Strength Index (RSI) indicator is deep in oversold territory. Therefore, it makes gold sellers wary of the next drop in gold price.
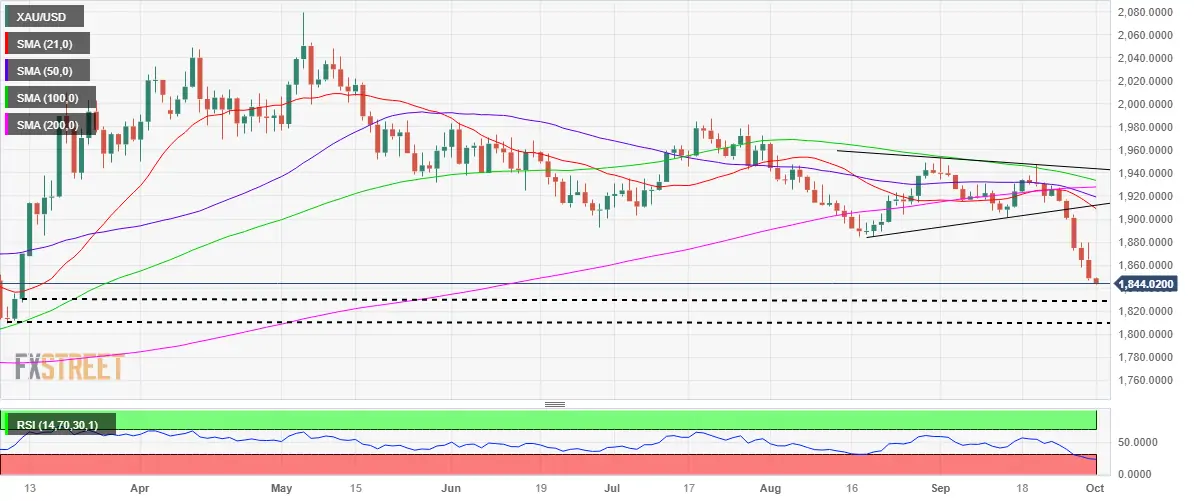 Gold price daily chart
If gold sellers manage to flex their muscles, there is support at $1,828, the March 10 low. However, we should not ignore the yellow metal testing the static support at $1,810 below this. Any correction in gold price from seven-month lows may face a minor hurdle at the $1,850 level, above which the $1,880 high of September 28 and 29 will emerge as a strong resistance. It will need to rise above this level to surpass the $1,900 threshold once again.
To be informed about the latest developments, follow us twitter ‘ in, Facebook in and Instagram Follow on and Telegram And YouTube Join our channel!