Gold hit its lowest level in the last seven months at $1,815 on Tuesday. After this, it licks its wounds around $1,820 on Wednesday. All eyes are now on the high-impact US ADP employment data and the ISM Services PMI report for a new trade momentum in the gold price.
US Dollar and US Treasury yields are suppressing gold!
DXY has entered a bullish consolidation. US Treasury bond yields remain at a 16-year high. In this environment, gold is some distance away from multi-month lows looking to build on the previous recovery. Benchmark 10-year US Treasury yields are trading at 4.85%, up 0.90% daily.
cryptokoin.com As you follow from , the US economy remains resilient. This increases bets that the US Federal Reserve will raise interest rates again by the end of the year. Therefore, US Treasury bond yields continue to rise. The number of job openings unexpectedly rose by 690,000 in August to 9.610 million, the U.S. Labor Department said Tuesday, the biggest increase in more than two years. Data showed that the labor market in the US is still tight. This gives the Fed leeway for further tightening.

The relentless rise in the US Dollar and US Treasury bond yields triggered a new decline in the gold price. Because the yellow metal has no interest income. That’s why the shiny metal hit its lowest level in the last seven months at $1,815. After this, it is trading at $ 1,820 with a modest recovery move.
The shiny metal is at the mercy of this data
Critical US ADP private sector Employment Change data is due on Wednesday. Amidst this expectation, gold investors are taking a cautious stance. That’s why he’s staying away from making new bets amid the ongoing uptrend in U.S. Treasury yields. US ADP payrolls, which were announced as 177 thousand in August, are expected to be 153 thousand in September. A slowdown in the U.S. labor market could reduce bets on a final Fed rate hike this year and trigger a long-overdue correction of the U.S. dollar from multi-year highs against its major rivals.

However, it is possible that the data will surprise on the upside. In this case, a new US Dollar rally should not be ignored along with US Treasury bond yields. This will likely strengthen gold sellers. Investors will also follow US ISM Services PMI data. Additionally, the Fed will be watching the Fed speech for more clues about the interest rate outlook. Because these data have the potential to affect the US Dollar and gold price.
Gold price technical analysis
Market analyst Dhwani Mehta evaluates the technical outlook for gold as follows. From a short-term technical perspective, nothing seems to have changed for the gold price. For now, a correction from the seven-month low remains on the table. The 14-day Relative Strength Index (RSI) indicator remains oversold. Thus, justifying the recent recovery of gold price. If gold makes a good comeback, it will challenge the initial support-resistance level at $1,850. The next upside barrier stands at $1,880, the September 28th and 29th highs on the recovery path.
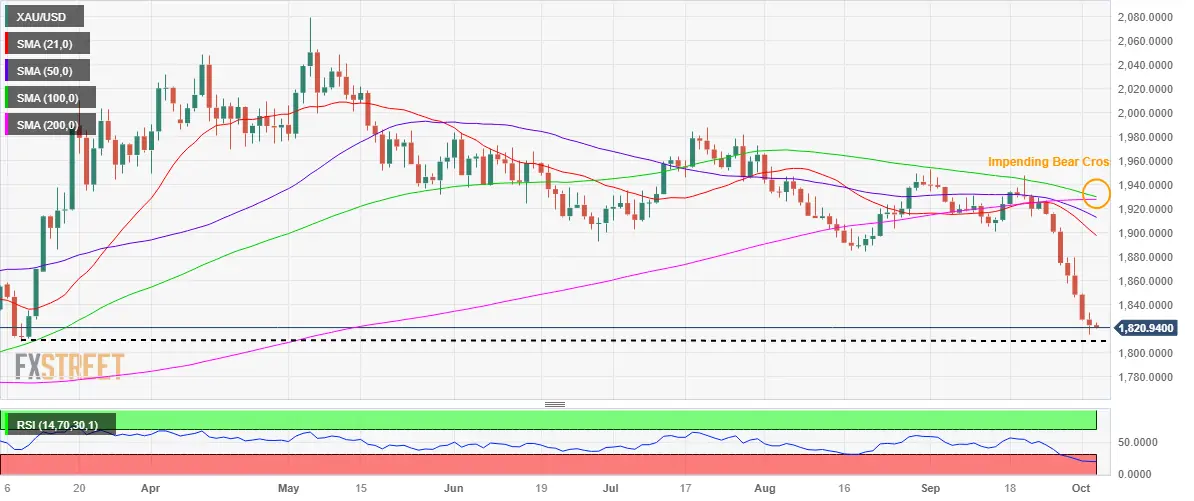 Gold price daily chart
However, things will change if gold buyers fail to find a strong foothold above $1,850. In this case, it is possible that the downtrend will gain momentum once again. The gold price will need to break the previous day’s low of $1,815 to reach the important support at $1,810, where the March 8 low was recorded. Additionally, the $1,800 threshold will be a difficult level for gold sellers to break. The 100 Day Moving Average (DMA) is trying to cross the 200 DMA from above. This suggests that any pullback in gold from monthly lows is temporary.
To be informed about the latest developments, follow us twitter ‘ in, Facebook in and Instagram Follow on and Telegram And YouTube Join our channel!